
|
Every year for the last quarter-century, the Department of Physics and Astronomy at Northern Arizona University (NAU) has hosted a cohort of summer student researchers through the National Science Foundation’s Research Experiences for Undergraduates (REU) program. A look through our listing of previous REU students shows an impressive number of projects across a huge range of topics. I even see some names I recognize as people who are now leading researchers in astronomy and astrophysics.
As new faculty in astronomy at NAU, it was inevitable that I would catch on to the REU excitement. While I have worked with several undergraduates on research projects, I have never worked with a REU student. The bar for working with an REU student is quite high. While typical undergraduate researchers have an academic year (or more) to work on a project, an REU student is expected to progress from arriving in Flagstaff to a completed research project in just nine weeks. It seemed rather daunting to me. The process of pairing REU students with research advisors is not exactly straightforward, but I was super pleased to be paired with a bright physics student, Juan Tolento, from Cal Poly, San Luis Obispo. Juan arrived in mid-June, and we quickly settled on a research project in atmospheric physics. Our idea was fairly straightforward; we wanted to develop a simple model that could predict various energy fluxes in planetary atmospheres. Typically, planetary atmospheres are divided into a troposphere ¾ the deeper part of an atmosphere where convection occurs ¾ and an overlying, more-tenuous stratosphere. You and I live in Earth’s troposphere. In the troposphere, energy sources are solar energy (e.g., sunlight reaching Earth’s deep atmosphere and surface) and/or internal heat trying to escape the planet. Internal heat sources can be comparable to the energy absorbed from the Sun for Jupiter, Saturn, and Neptune (but not Uranus, which is still a mystery in planetary science). Atmospheres have two key ways of moving input solar or internal energy out of the troposphere: thermal radiative transport and convection. Both of these processes can move energy up from the deep atmosphere to the top of the troposphere where, typically, thermal radiative transport then allows the planet to cool to space. Convection moves energy through the rising and falling motions of atmospheric masses, while thermal radiation moves energy through a net upward “flow” of infrared light. In equilibrium, the sum of the thermal radiative energy transport plus the convective energy transport must equal the input solar energy plus the internal heat. If this equality did not hold, an atmosphere would be heating up (more solar or internal heat input than thermal and convective cooling) or cooling off (more thermal or convective cooling than input solar or internal heat). The first task for Juan (and I) was to investigate and solve the differential equations that describe the upward and downward transport of thermal radiation. (The difference between the upward and downward transport gives you the net transport.) We ventured into some gnarly math, which I will spare you. Nevertheless, Juan and I arrived at a succinct expression for the net transport of thermal radiation in a planetary troposphere. What was especially awesome was that our expressions were able to reproduce results from much more complex models applied Venus, Earth, and Jupiter. With our equations in hand for the net thermal radiative transport of energy, coupled with a simple treatment of the absorption of sunlight in planetary atmospheres, Juan and I only needed to apply the equilibrium statement above (that thermal radiative and convective cooling must equal solar and internal heat sources) to describe the extent to which convection is moving energy in a planetary atmosphere. The figure below shows profiles of energy flux due to solar absorption, thermal radiative transport, and convection for all Solar System worlds with thick atmospheres. I think it is quite amazing that all of these results came from a few expressions ¾ you could write them on the proverbial “back of an envelope” ¾ which capture the fundamental physics of planetary tropospheres. All accomplished over a couple of months! Oh, and for anyone who wants to see the math, here is a link to the paper that describes Juan’s work!
1 Comment
In April I updated everyone on the status of the DART (Double Asteroid Redirection Test) mission and our plans to observe the Didymos system before the impact in 2022. Last month, the Didymos observers gathered in Prague at the Villa Lanna, a property of the Academy of Science of the Czech Republic. We were lucky enough to be hosted by our Czech colleagues Petr Pravec and Petr Scheirich who did a great job organizing our stay. During the workshop, we had talks that included discussions of the physical properties of near-Earth objects, tools that could be used during the Didymos observing campaigns, and future concepts to further our study of NEOs. Of course, the heart of the meeting and discussion was our plans to observe the Didymos system prior to and after the impact. I am leading the observing effort and I'm very excited to have such a great group of people interested in participating. As I'll often tell people, I really enjoy planning observing runs. During the planning, many things are possible and you're not hindered by bad weather yet. What does it look like to lead a multi-year observing program with multiple observers? I'm in the process of designing a website where we can post relevant information (including deadlines for telescope proposals) and can easily share information. One of the challenges is that all of the observing results are important to the modeling efforts that are being done by other DART working groups. So, the observing working group needs to make sure that we produce results quickly so that all the work that is dependent on us can also move forward. Communication is going to be key! I'm also working out when we can meet in person at various meetings in the coming years. I'm doing my best to take the lessons that other observing groups have learned in the past and incorporate them into our program early. We have two more windows to improve our understanding of the system before the 2022 impact: early 2019 and mid 2020 to early 2021. Didymos is going to be faint during these observing windows so we'll have to use some of the largest telescopes on the planet to get the precision that we need. Petr Scheirich gave a great talk at the meeting where he discussed exactly how many successful lightcurve observations at a given signal-to-noise we needed to hit our goals during the two upcoming observing windows. His work is going to be a very important metric for us to understand the ongoing success of the observations. The reason for this precision is that we need to know where Didymoon will be with respect to Didymain at the time of impact. Also, having a really clear understanding of the system will help us better understand how the DART impact changes the system. The first observing window is coming up soon so we're all getting ready to write observing proposals this fall! After the meeting ended, I had the opportunity to explore parts of Prague. The city is beautiful and has strong connections to astronomy. I took the time to visit the church where Tycho Brahe is buried, the house where Johannes Kepler lived during his time in the city, and tried to see the astronomical clock. Unfortunately, the clock was being renovated when I was in town, so I'll have to find another opportunity to visit.
Going to switch gears a little and talk about a personal topic: being a PhD Student with a chronic (and invisible) illness. At about the age of 25 I was diagnosed with “chronic migraines without aura without cause”. I was getting one severe headache/migraine about every other day, weekends included. My doctor put me on a blood pressure medication to prevent them and gave me what many who get migraines call their life saver – Sumatriptan. Sumatriptan is basically a beefed-up and slightly reformulated form of Aleve, but it has the power to stop a migraine dead in its tracks within half an hour. The blood pressure medication didn’t work to reduce the number of migraines to below “chronic” (four a month), so we tried something else. That didn’t work either, so (after switching primary care physicians) I saw a neurologist who ordered a CT scan and MRI (that’s the “without cause” part – there was nothing in the scans to identify a cause). She put me on what I currently take, which is Topamax (an anti-seizure medication and one nasty drug). I currently have about four migraines a month, which was kind of the goal, but still not ideal and at least now I’m not using more than a monthly supply of Sumatriptan. Why do I tell you this? Because I’m a heckin’ PhD student! I need my brain! Getting a dozen migraines a month would be crippling and one side effect I may be dealing with on Topamax is “cognitive disability” and issues with “word finding”. Word finding basically means that, even though in my mind I’m articulate and have a very broad and flexible vocabulary, I don’t have access to it all the time, especially when speaking; it’s something that I know I deal with because of how frustrating I feel when I stumble through sentences, when I didn’t used to. Migraines are typically “triggered” by something – my triggers (among a couple others) are stress, high pressure weather systems, and general sedentary lifestyle. If I could change the weather I could because I know other migraine sufferers who get severe headaches when the weather changes, but moving to Flagstaff has alleviated many of those issues. On the sedentary lifestyle - when I was working a 9-5 job for the last 6 years, I was guaranteed to have a migraine every Friday that would wear off around Sunday afternoon. It was from sitting in the office all week long, barely getting up, and not moving around, and allowing the stress to build in already-tense areas. It got better when I would take a working lunch and walk/jog the path behind my building, but it was still not ideal. STAND UP AND MOVE AROUND PEOPLE, YOU ARE DOING DAMAGE TO YOUR BODIES! And then there’s the stress trigger – the part where I tell everyone to chillax and be cognizant of the relationship between sitting around and stress. “Well how do you know stress is a trigger?” Because I had a migraine during my Astrochemistry Final that got worse as the exam went on, I had one during a panel I was on at a comic convention, and I would get one anytime immediately before, during, or after I’m about to do something that would increase anxiety or stress levels to above a typically manageable state. So here’s what I do for that: Students have free access to the gym, where we have classes like yoga, pilates, and other core-centering and thoughtful meditation practices – there are also YouTube videos for these. Just running on a treadmill or using a row machine can help release good hormones and de-stress. My campus just started group acupuncture – that’s next on my list. It’s $15 and even has a “good for migraines” blurb on the advertising poster. There’s discounted massages through the local massage school or Health Services. My college’s website has a whole webpage dedicated to stress management programs – check out yours or find some places on the web. I’ve learned to take time for myself during the day. I generally plan my work day to the hour; every other hour I do a strenuous thing (heavy research, time blocked out for class, etc.) and then the other hours are more relaxing (e.g. work on research or a paper that is less stressful, make a figure, work on educational materials). This has the added benefit of planning work well in advance to prepare for the stress (studying well in advance of that Astrochemistry Final, for example, although I definitely didn’t plan enough, which led to the amount of stress I did have). When I’m at home, I try to plan my time so that I avoid being sedentary – I’ll do a strenuous thing for an hour (work out, work on a sewing project, cook dinner, etc.) and then something that doesn’t require significant mental or physical assets (e.g. play a video game, watch a show, or read a book for pleasure). It’s important to find things that allow you to unwind and refocus. It’s amazing the damage that stress can cause, especially in the long-term; to our minds, to our bodies, to our general level of well-being. When all else fails and I do wind up with a migraine (because the stress is mightier than the management), I’m lucky enough to have Sumatriptan. I recognize not everyone is so lucky and if you are finding yourself having more than four severe headaches a month (especially coupled with nausea; vomiting; sensory sensitivity including light, sound, smell, etc.; dizziness, etc.) that you talk to your doctor. Take care of yourself, it’s the only you, you have!   Very serious science is done here. Ah, summertime. A time when most of our students here at Northern Arizona University are on vacation from school and can be found traveling, visiting family, and even trying to make some money for the fall semester with a summer job. It’s a time when faculty can work on research in peace and quiet, or maybe even do a little traveling of their own. OR IS IT? Here at the NAU Department of Physics and Astronomy, we offer a wide range of four introductory classes during the summer for your physics course requirement needs! We also offer some summer independent courses, but who cares about those, I don’t teach them. Whether a student is trying to get ahead, or make up for a previous failure, we have what they need. Our course offerings run for a four week term, four days a week, for a true physics boot camp experience that students love! But seriously, taking summer courses can be a useful and rewarding experience for a student, and teaching those courses is something that I have been doing every summer since 2010. In this time, I have come to look forward to teaching summers for the change of pace from the regular semester classes, but if a student isn’t prepared, these changes can really take them by surprise. Thus, I would like to outline some of those differences, both pro and con, for a prospective student enrolling in one of our department’s summer course offerings. The first aspect of summer school that I consider a pro is class size. Our intro to physics lectures during a regular semester are usually held in lecture halls with somewhere between 100 and 200 students per section. Summer school courses usually never run larger than 50 students, with the typical size being around 20 students. These courses can be taught more as a typical classroom, and I have the ability to actually learn the names of my students.
A second feature of summer school classes that many consider an advantage is the narrow focus on a single class in a short window of time. A typical summer school course fits all of the content of a 16 week regular semester course into just 4 weeks. This allows a student to focus entirely on one subject, and the course is over before a truly bad case of burnout sets in. Third, getting around on campus is just much better during summer school. The days are warm, there’s never any ice to slip on, and the parking lots are empty.  A typically crowded footpath between classes during summer session. Now this may sound wonderful and it is, but summer session classes are not without their own brand of unique challenges. I asked Dr. David Cole for some insight on these challenges and how to overcome them. He has the following words of wisdom:
Please realize that every day in summer school is about the same as one week of class. So you really need to “know yourself” as a learner, and as a student, to be successful. How do “I” really perform under pressure? Can “I” really balance the pace and perhaps another course and perhaps a job and perhaps family obligations…..etc.? Also realize the temptation to “chegg” [Use websites with homework solutions] will be greater, and this must be resisted with an even greater will power. The importance of forming a good study group goes way up. The importance of good time-management goes way up. The importance of staying healthy so you don’t miss even a single class goes way up. The pride of success in a summer course goes way up too. And there you have it. Summer school classes are a fast paced environment that can get a student caught up or ahead on their degree path, and can be a very rewarding experience if a student is ready for the commitment of doing a semester course in a month. I enjoy teaching these courses and if you’re a prospective student reading this, hopefully I’ll see you in the summer. Did Einstein really say, “The definition of insanity is doing the same thing over and over and expecting different results,” or something along those lines? Who knows. Regardless, is this statement correct? In principle, if all conditions are kept identical, we certainly hope it would be, otherwise science itself is likely to be in a precarious position. I note that I am not talking about uncertainty in quantum systems – I will leave that discussion to the experts in the Department. The question I am asking is, how reproducible should we expect our own measurements to be? This is not as straightforward of a question to answer as it may appear at first glance. Many of you have probably heard of the “reproducibility crisis,” which is expected to exist in all fields of science. Quoting from the Nature paper cited below, “Data on how much of the scientific literature is reproducible are rare and generally bleak. The best-known analyses, from psychology and cancer biology, found rates of around 40% and 10%, respectively.” This is pretty shocking, at least it was to me, but as discussed in the second article below, perhaps the “crisis” is overstated. I do not intend to give an in-depth analysis of this somewhat contentious topic, but I think it is not a bad idea for everyone involved in science to become acquainted with the issue, or to simply recognize that it might exist. At worst, nothing will change; at best, science, in general, will benefit, potentially for the greater good of everyone. I highly recommend the articles cited in the next paragraphs. They are short, easy to read, and quite interesting in my opinion. The first is a review of a survey that was published in Nature a couple of years ago by Monya Baker (Nature 533, 452 (2016)): titled “1,500 scientists lift the lid on reproducibility,” which at least gives a current snapshot of scientists’ mentality about this controversy. Some of the most interesting parts of the article, in my opinion, were how many researchers reported not being able to replicate results. For example, in physics, which is apparently one of the more reproducible fields, at least in a relative sense, greater than half of respondents admitted being unable to reproduce their own results. (It is important to note that the article did not imply these irreproducible results were published, although we can imagine some of them went on to be made public). Unsurprisingly, the top (self-) reported reasons given for irreproducibility in published research are: selective reporting, pressure to publish, and low statistical power. But, is there truly a problem? “I argue that this crisis narrative is at least partially misguided,” incredulously stated Daniele Fanelli this year in a PNAS article (Proc. Natl. Acad. Sci. 115, 2628 (2018)) titled, “Opinion: Is science really facing a reproducibility crisis, and do we need it to?” The following plot from that article shows the possibility that the idea of a crisis might be somewhat of a fad: 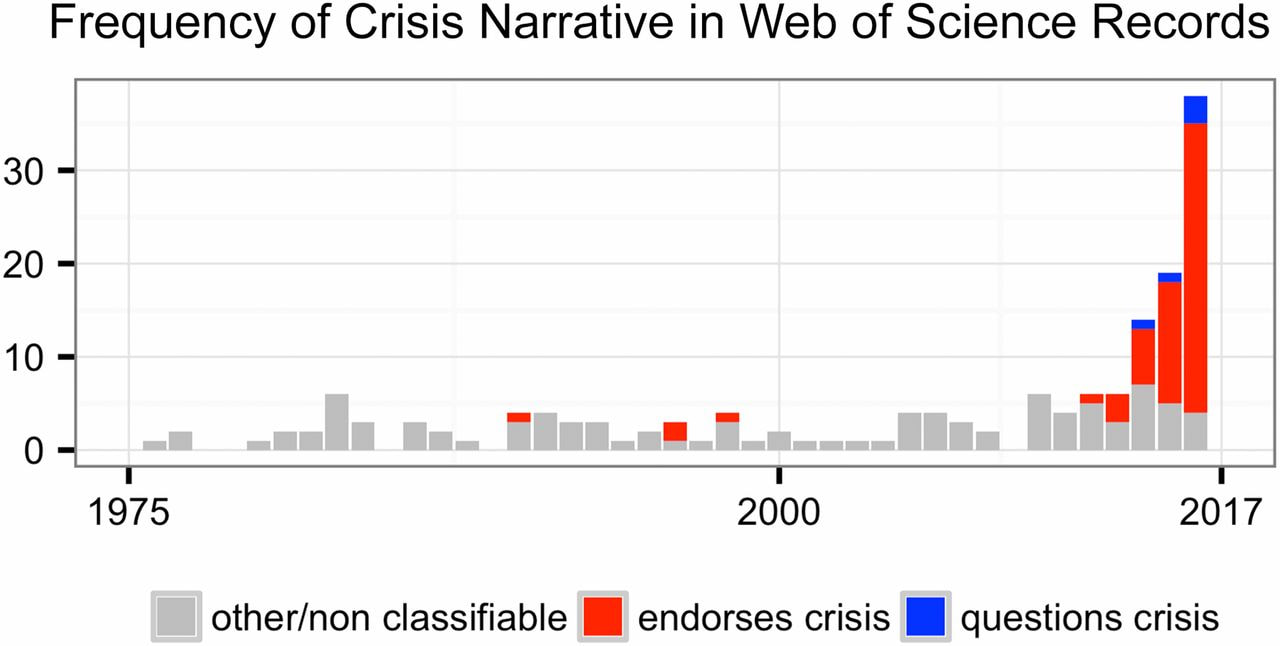 There is certainly a clear trend that a greater percentage of researchers are agreeing a crisis exists as time progresses. Is this because the problem is becoming worse or are we simply becoming more cognizant of it? In other words, has science always had such flaws, but we are only now talking about them openly? Interestingly, due to the subjective nature of the data on reproducibility, with much of it being opinion-based, it can be difficult to tell if there is a problem or not. I tend to be a bit more optimistic, which might come as a surprise to those of you who know me. Nevertheless, in my mind, I think it is reasonable to expect flawed studies to fall to the wayside over time and properly conducted research will ultimately prevail. In summary, it is probably healthy for all of us to recognize that there is a potential problem in our field and not only to practice being as objective as possible in our own work, but perhaps also to learn to think objectively about our own thinking. It can’t hurt.
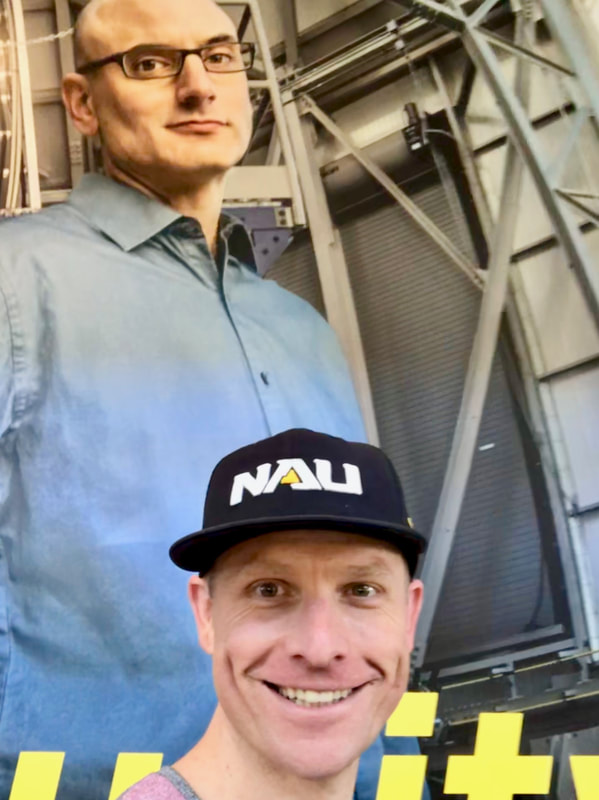 Figure 1: Colin in front of the David Trilling mural at FLG airport. This week I stopped back in San Francisco on my way to Hawai’i. Before boarding my flight at the Flagstaff Airport, I took the obligatory selfie in front of a giant NAU promotional poster featuring our Ph.D. program coordinator David Trilling. I resubmitted a paper to the Publications of the Astronomical Society of the Pacific titled “Searching Asteroids For Activity Revealing Indicators (SAFARI)” which is (hopefully) very close to being accepted. The referee (Henry Hsieh) is the leader in the field of active asteroids (asteroids that look like comets) and has provided incredibly helpful suggestions and comments. As my partner always says, “It will only make the paper stronger!” 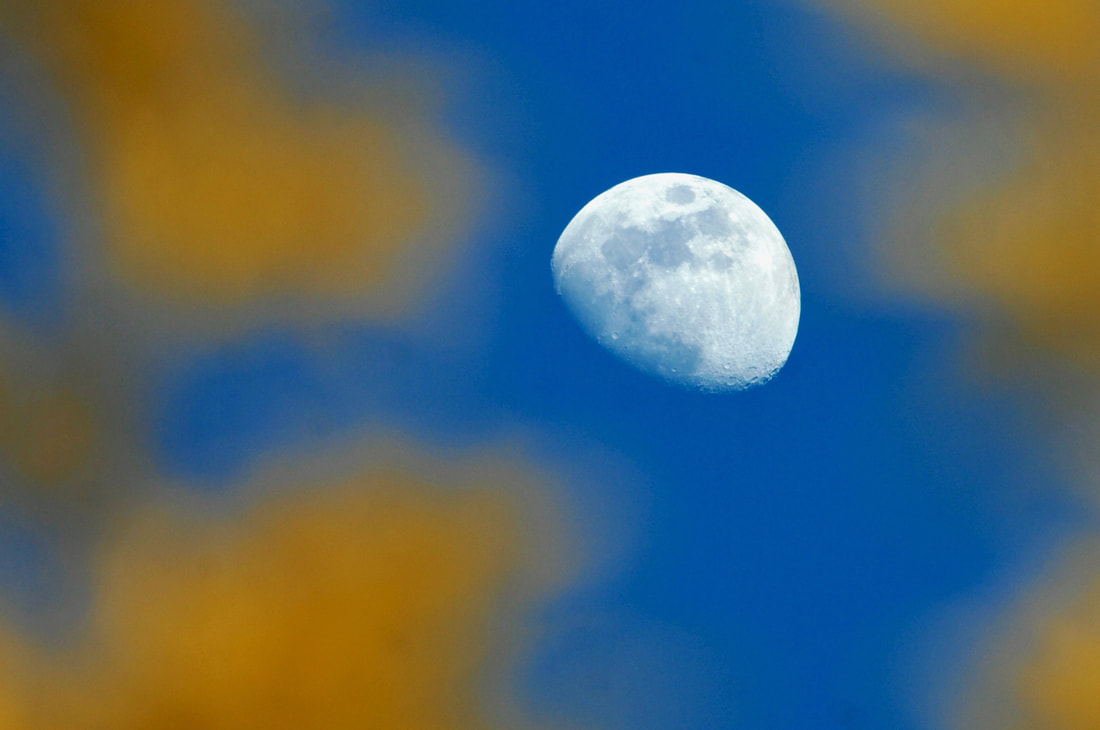 Figure 2: The Moon through leaves. (C) 2018 Colin Orion Chandler. Most days are I at least spend part of the day working aside my partner Mark, a cancer scientist at the University of California San Francisco. We often go to Whole Foods or Starbucks, camp out and do science. This week I also visited with a couple of my best friends, including Daniel. He was on break from studying particle physics at a school that shall remain anonymous. I really gained new appreciation for just how well the Physics and Astronomy Department at NAU has spooled up our PhD program, especially how cohesive and progressive our department is; this really helps lubricate the scientific process. This week I began setting up project management for an upcoming project. I am really excited to be working with undergraduate student Jay Kueny on an upcoming Citizen Science project, the one I wrote about in my last blog post. The more I learn about Citizen Science, the more I realize how much work it takes to do well, and the more grateful I am to have Jay on the team. I continue to work on atmospheric modeling code under Ty Robinson’s guidance. I feel like I’m really getting the hang of FORTRAN (programming language), and I feel good about the direction the project is going. Ty is in Japan this week, but I will start working on an abstract for an upcoming conference. This will be my first atmospheric modeling presentation… exciting! 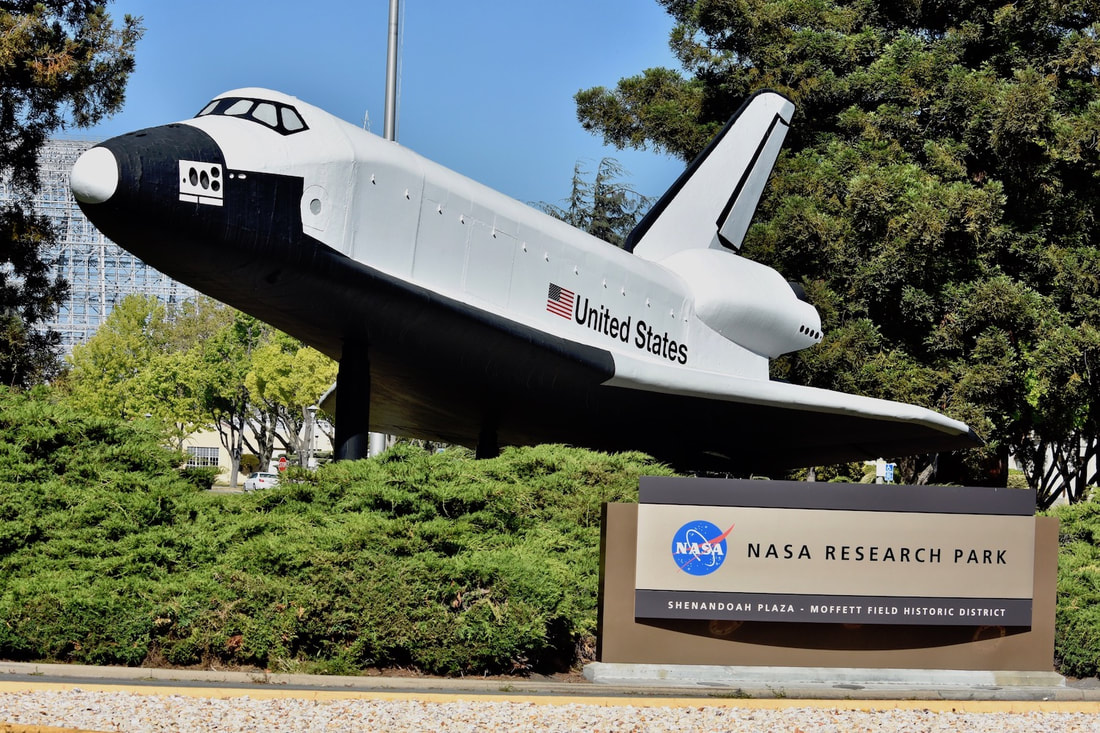 Figure 3: Entrance to NASA Ames Research Center. (C) 2018 Colin Orion Chandler. I attended Bay Area Exoplanet Meeting 25 at NASA Ames Research Center. I got to chat with UC Santa Cruz Professor Jonathan Fortney (who is on my committee), and meeting organizer Tom Greene, who I just saw present at Lowell Observatory. Jack Lissauer, author of the staple textbook Planetary Sciences, was also in the audience. I got to chat with Bruce Macintosh of Stanford University, who I last saw at the Exoclipse 2017 field trip to see the total solar eclipse. His direct imaging of exoplanets has produced some of the most inspirational images of solar systems forming! 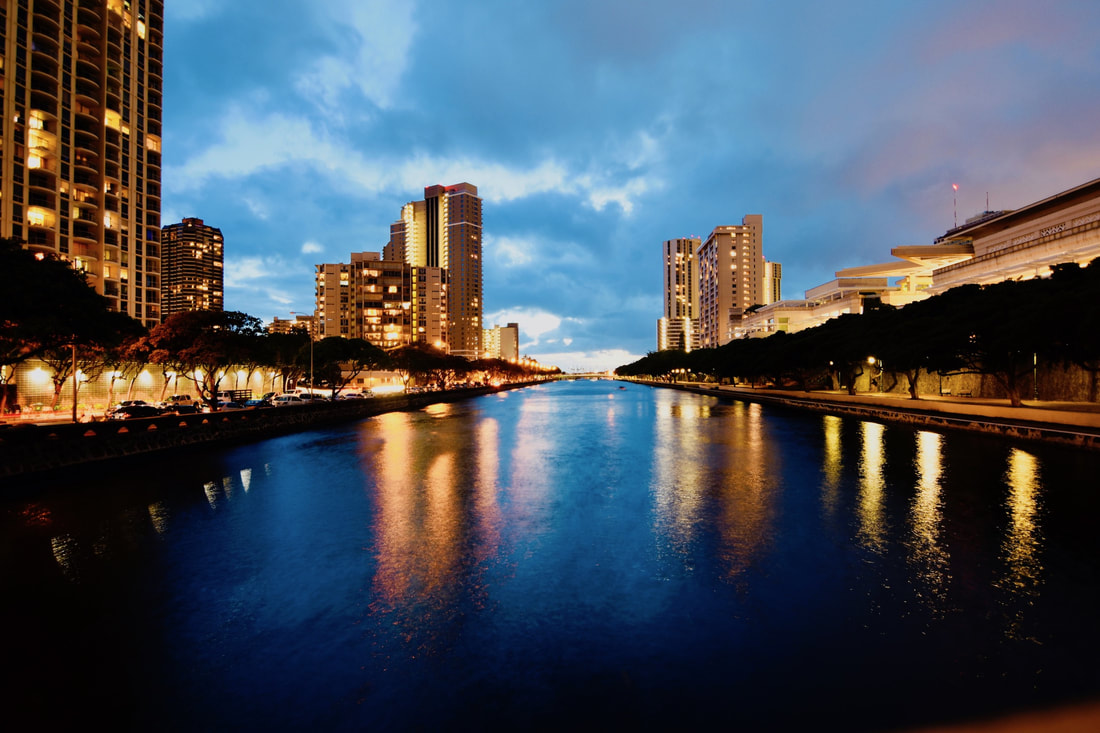 Figure 4: Hawai'i Convention Center. (C) 2018 Colin Orion Chandler. My partner and I flew to Honolulu, where I would be presenting at the 2018 Asia-Oceania Geological Society (AOGS) meeting at the Hawai’i Convention Center. On the flight from San Francisco to Honolulu, I discovered the person sitting next to me (Allesandro) works on the Juno mission and was also presenting at AOGS. He was coming from Rome, and suddenly my travel time didn’t seem so bad. He showed me some incredible pictures of aurorae and polar storms on Jupiter, just amazing! 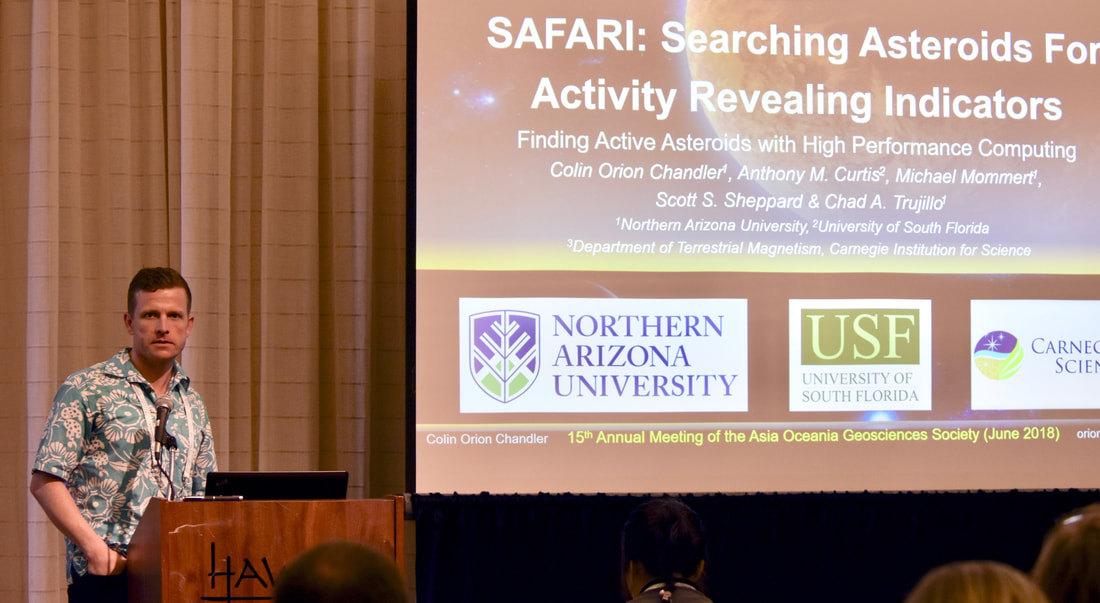 Figure 5: Colin Orion Chandler presents SAFARI at AOGS 2018. My presentations at AOGS went well, and I met a number of leaders in the field, including Henry Hsieh. It was great to see how much interest there is in Active Asteroids, including space mission proposals. Also on tap was the latest from Hayabusa2, the Japan Aerospace Exploration Agency (JAXA) sample return mission to asteroid Ryugu. My committee co-chair and advisor Chad Trujillo presented about his search for Planet X. He fielded an interested question from the audience: could Planet X be the real planet Clyde Tombaugh was looking for? (Probably not.)  Figure 6: Prof. Chad Trujillo presenting at AOGS 2018. (C) 2018 Colin Orion Chandler. Before returning to San Francisco then Flagstaff, I’m hoping to visit with friend and NAU alum Connor Auge who is now a PhD student at University of Hawaii Manoa. I also just finalized a week-long trip to University of California Riverside to visit and collaborate with my undergraduate advisor Stephen Kane. I’m looking forward to a late-July road trip and to seeing his new digs!
Since I arrived at the Department of Physics and Astronomy 6 months ago and started as a postdoc, I can’t help but feel a little out of place. My academic path started with a degree in geology, following a passion for volcanoes and rocks and minerals in general. Along the way, guided by a strong desire to work on active eruptions, I developed an interest in spectroscopy and remote sensing, and became convinced of their immense value in addressing a variety of scientific questions, as well as monitoring volcanic activity. For the past decade I have applied spectroscopic methods to the detection and quantification of volcanic gases, working both with UV and IR instruments. I use mainly ground-based instruments, which allows me to get close to the action, but not so close that I have to fear for my safety. Basically the best place to be on a volcano. This, to me, is the main driver. Of course the science questions are fascinating and I want to work towards a better understanding of how volcanoes work, and what we can do to help the populations that live in their vicinity to stay safe. But I would be lying if I said the appeal of observing eruptions up close wasn’t part of the equation when I design research projects. The other part of the appeal is that I get to work with cutting-edge technology. For my PhD, I developed a UV camera that takes images of a volcanic plume in two different wavelengths of the UV spectrum. It uses two synchronized cameras with separate filters, to produce maps of the amount of SO2 (one of the main volcanic gases) in the plume; and from those we can create time series of just how much SO2 is released over time (see the movie attached). After validating and calibrating the instrument at power plants in Arizona, I took this SO2-camera to a volcano called Semeru in Indonesia. Semeru is a massive stratovolcano (> 3,700 m), that has been continuously erupting since 1967. After a long drive in a 4x4 and an 8h hike, we set up camp on a plain at 2,700 m altitude with a clear view of the summit, where we stayed for several weeks. And since I wasn’t about to come all this way and not do it, I climbed the last 1,000 m amidst jungle and then steep scoria covered slopes to catch a view of the dome inside the crater, where I was stunned by several explosions before clouds rolled in and forced us back down. 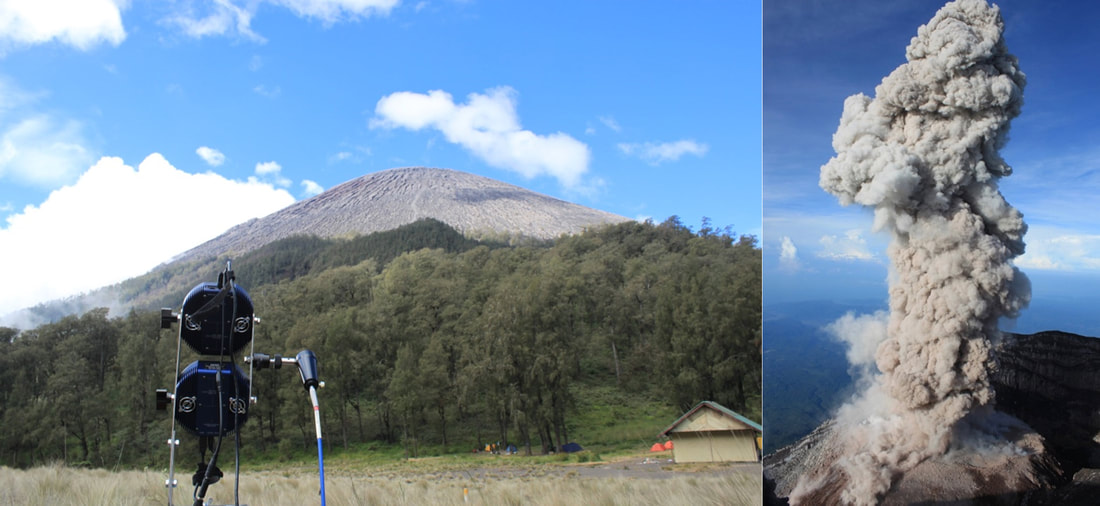 Figure 1. (Left) The SO2 camera observing a (mostly invisible with the naked eye) plume at Semeru volcano, Indonesia. (Right) Small Vulcanian explosion from the dome at Semeru, taken from the crater rim. On the other end of the spectrum, I also got to use a hyperspectral imager that operates in the thermal infrared (7-12 mm wavelength). The hyperspectral nature of the instrument means that it produces a continuous spectrum of IR light for each pixel in the image, which allows us to extract not only SO2 amounts, but also other gases. Plus, it works at night as well, contrary to the UV instruments. We took it to Stromboli volcano, which was a true adventure. Stromboli is a small island, part of the aeolian chain between Sicily and the main land of Italy. It is a tourist destination and part of the field campaign involved setting up the instrument on the terrace of a restaurant by the coast. The other point of view we chose was on the crater rim, which meant bringing the instrument up the steep cone. Between the instrument itself, the accompanying computer and tripod, and the gas generator needed to power all of it for several hours, we had ~ 250 lbs of gear and the hike which normally takes 2h, lasted about 6h. But it was all worth it for the data, and of course for the experience of seeing glowing lava being expelled from the crater at night. 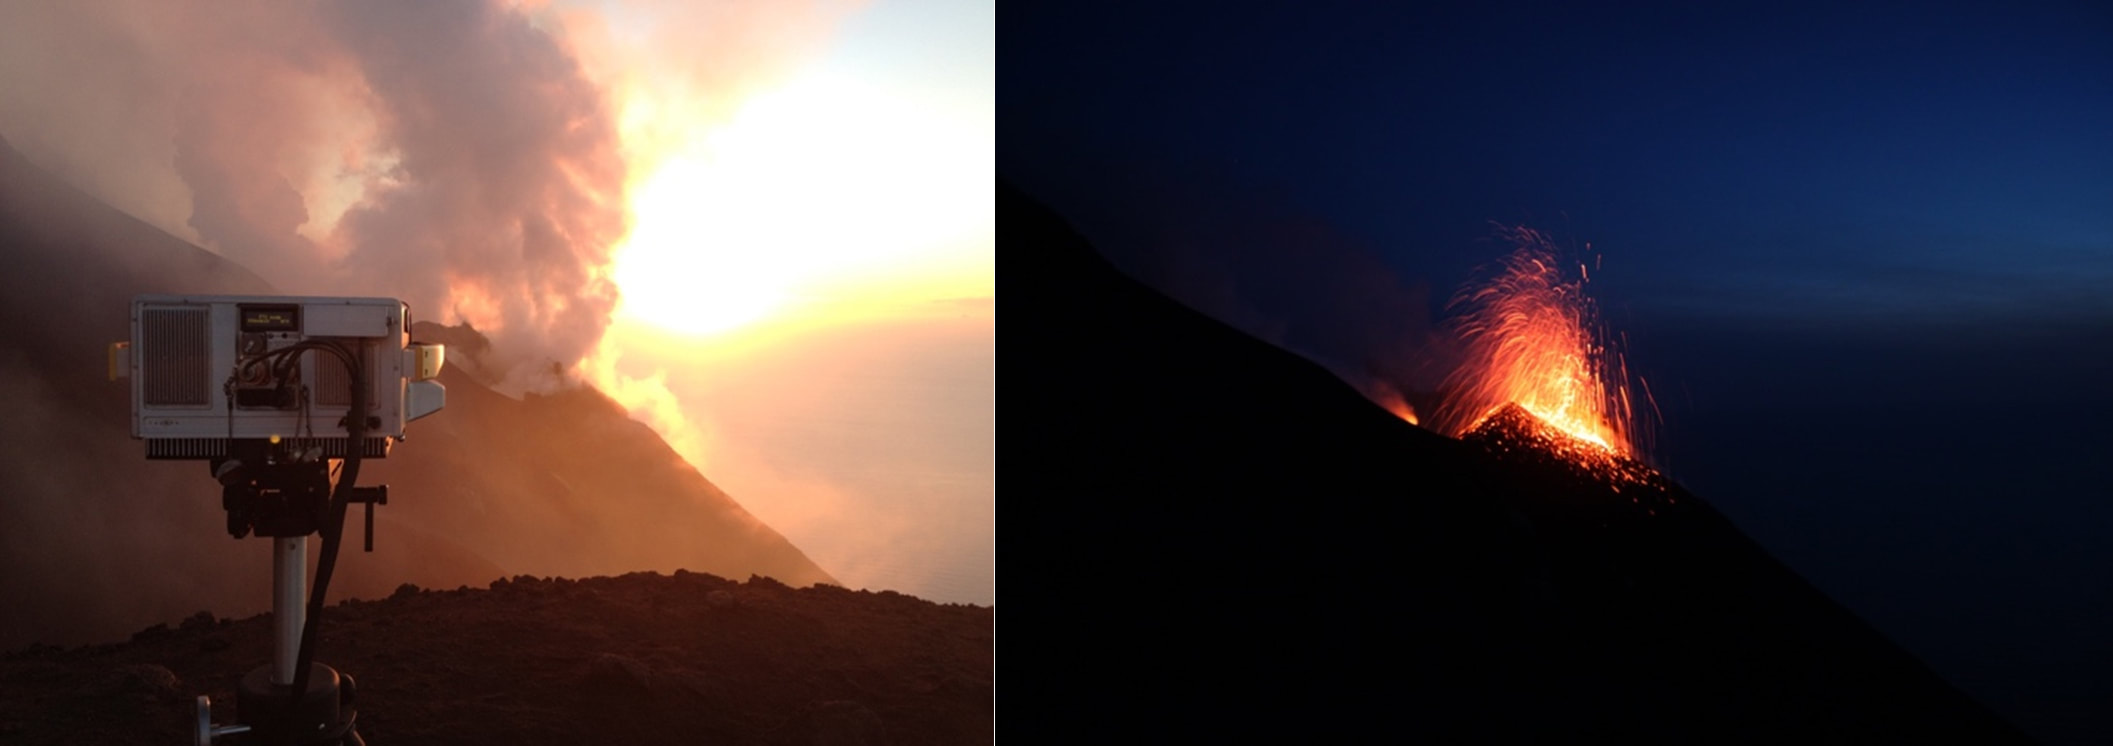 Figure 2. (Left) Telops Hyper-Cam LW, hard at work monitoring the plume from Stromboli's NE crater at dusk. (Right) Small explosion from the NE crater just a short time afterwards. So yes, when work is THIS fun, there is strong incentive to keep at it, right?
This whole week I have been mulling over what to write for this blog because I have never done one before. Finally, it dawned on me; I should write about my experiences in our department. I have been a student in the physics and astronomy department since Fall of 2013 and I have had a blast learning from all our amazing faculty. I have taken many classes in our department, even some which are currently not being taught (Data and Error Analysis and Applied Physics). Each of these classes helped shape the researcher I am today. I must say the courses offered all have their unique style in developing a student’s skill set which would be most applicable to any research the students may undertake. After this semester, my required classes for my degree are complete and it is such an odd feeling to have come so far and have learned so much to push me forward into what is to come: the road to PhD candidacy. I remember this time of year being very stressful and exciting for all the master’s students in our department, including myself a few years ago. Everyone is trying to finish up their class work, defend their amazing research projects, and finish their thesis corrections, all before graduation (Congrats to all that have passed their defense these past few weeks!). I remember how I felt during the build up to my defense, writing and rewriting my slides to ensure I did not miss any vital piece of information. Once the defense was said and done, it came time to work on cleaning up all the lose ends to the thesis. These corrections were some of my favorite parts to the writing process because I continued to learn new material even after completing research and gave me insight into what other types of research I may want to undertake in the future.  Since I am a second year PhD student, I must complete both my qualifying exams. Luckily enough I spent the latter part of my third semester working on the written exam. I was very excited to receive the news the beginning of March to have passed the exam! Next up is my oral qualifying exam which is set to take place this summer (Monday July 30th at 2pm in room 321). This is a very exciting time because it is just another opportunity to learn more and to move forward in the program. I have many tasks to complete before this oral exam, but who wouldn’t?
I hope everyone has a great end of the semester! While stress is a bad thing in our day to day lives, stress in materials can be exploited to achieve useful properties. For instance, computer processors have become faster and faster over the last few decades exploiting stress in semiconductor materials. The stress causes the charge carriers to have a lower effective mass and this, in turn, increases their mobility. This increases the clock speed of the computer processors. As our laptop becomes old, the semiconductor material “gets tired” of the stress (so to speak) and the atoms start rearranging themselves to lower the stress. The increased carrier mobility is lost and the effect is seen in the laptop speed, which starts to slow down. Epitaxially grown films are those that are grown directly on top of a base (called a substrate) using a fabrication method like Chemical Vapor Deposition (CVD) or Physical Vapor Deposition (PVD) or Atomic Layer Deposition (ALD) or Molecular Beam Epitaxy (MBE) or any of their variants. All materials have a favorite interatomic distance that is energetically most suitable. This distance is referred to as the lattice constant. If the lattice constant of the substrate matches that of the material being deposited on top of it, atoms can neatly form a layer on top of the substrate. However, often, there is a mismatch in the lattice constants of the substrate and the material on top. As shown in Figure 1, when the lattice constant of the thin film at the top is greater than that of the substrate, the atoms of the film have to be squeezed so that they can sit on top of the substrate. Similarly, when the lattice constant of the thin film at the top is smaller than that of the substrate, the atoms of the film have to be pulled apart so that they can sit on top of the substrate. This causes compressive and tensile stress respectively. 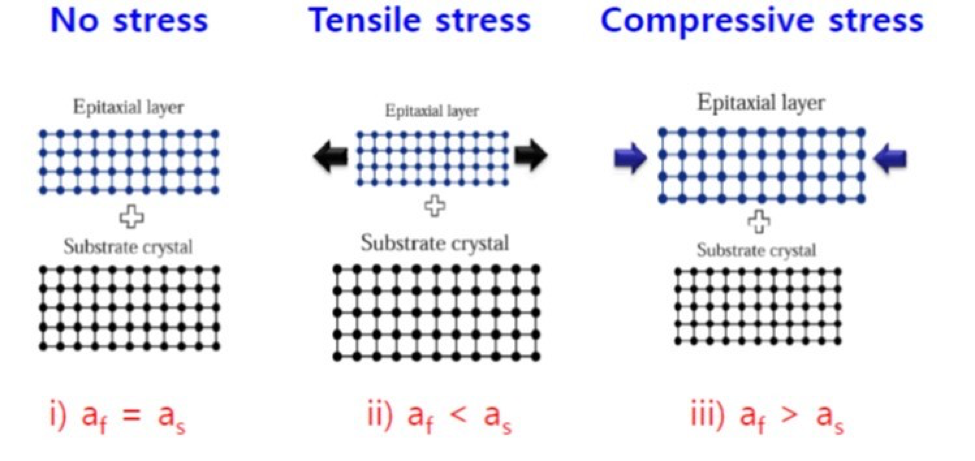 Fig. 1: Compressive and tensile stress (Source: Semiconductor Engg. Jour. 2017). A typical E-k plot (Energy vs Reciprocal space vector) of semiconductor materials looks like this. Notice the plot for the hole is less steep than that of the electron. 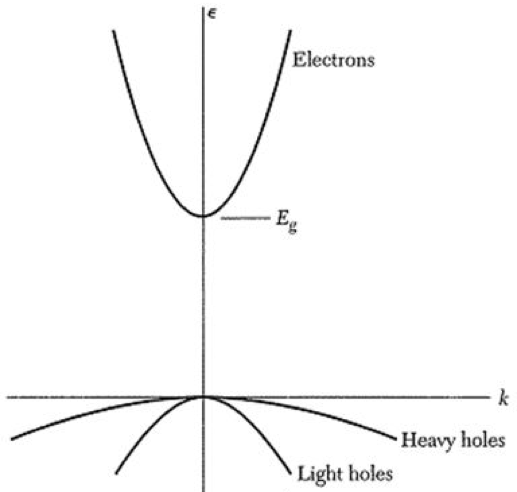 Fig. 2: E-k plot of a typical semiconductor material (Source: Kittel 8th Ed). The effective mass of a charge carrier is given by this equation below. Here the denominator is the curvature of the E-k plot.  The higher the curvature is, the lower the effective mass is and the faster the carriers can travel. This explains why electrons have a higher mobility than holes do. By engineering a stress, the curvature can be made steeper, thereby increasing mobility. The measurement of stress in material becomes crucial in design and research of this technique. Stress affects the vibration modes of the atoms and this causes a shift in the Raman spectrum. Hence, Raman spectroscopy is often used to ascertain the stress level in material. 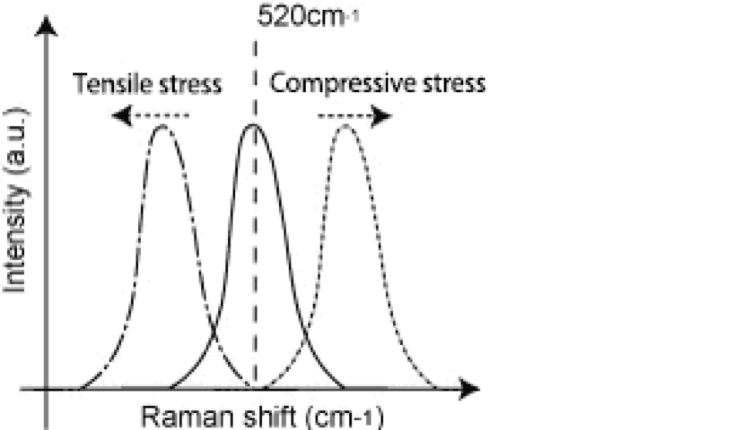 Fig. 3: Raman spectrum shift with stress (Source: www.nanophoton.net). So next time your phone or laptop slows down as it gets older, don’t assume that the vendor has deliberately done this to force an upgrade. Often, it’s due to the way the faster speed was achieved in the first place!
Many months ago I was asked to write a chapter on “Earth as an Exoplanet” in an upcoming book called Planetary Astrobiology. Since the due date for the chapter would be six months down the road, I accepted the invitation and ¾ like any reasonable person ¾ promptly forgot about my obligation. Unfortunately I couldn’t remain in blissful ignorance forever and, just this semester, my editors returned with their collections tray in hand. I guess I would need to write some words after all. I knew that something I wanted to cover in the chapter was a famous study by Sagan et al. (1993) (yes, that Sagan) which used data from a couple flybys of Earth by the Galileo spacecraft (en route to Jupiter) to study our planet as if were any ol’ Solar System planet. The goal of this work was to use as little prior information as possible. Basically, treat Earth as a newly-observed planet, and see what you could learn. Between the Sagan et al. (1993) manuscript, and a companion paper from Drossart et al. (1993), these scientists did some amazing things. Using thermal emission observations, they were able to back-out temperatures at various locations on Earth’s surface. Also, using reflected-light spectra, these authors showed that the bright, shiny regions spotted near the planet’s poles were water ice. Since the observed temperatures spanned the melting point of water and the poles were ice-covered, you could deduce that the planet was habitable ¾ Earth had liquid water on its surface. What’s more is that these authors presented multiple arguments for Earth being inhabited: the atmosphere was in a state of strong chemical disequilibrium, green-ish regions on the surface showed weird reflectance features at red/near-infrared wavelengths (known as the “vegetation red edge”), and something on the planet was beaming radio waves at very specific wavelengths. I had always had a “problem” with the Galileo Earth flyby results, though ¾ no one seemed to have the data in any usable form. I mean, calibrated visible photometric observations (from the Solid State Imaging [SSI] experiment) and near-infrared spectroscopic data (from the Near Infrared Mapping Spectrometer) would be great for studying how a distant, Earth-like exoplanet would appear to telescopes like NASA’s HabEx and LUVOIR concepts. I became determined that, come Hades or high water, my chapter would have useful, calibrated Galileo Earth observations. I would find the original data (not too hard), calibrate it (no idea how to do this), and publish it. The quarter-century-old observations would be resurrected. The Planetary Data System (PDS) that NASA maintains, as well as JPL’s PDS Image Atlas, brought me the raw SSI image files. Great, but how was I supposed to turn raw images (where each pixel usually has units of something like a scaled count or count rate) into something with physical units (like radiance units of energy per unit time per unit area per unit solid angle)? 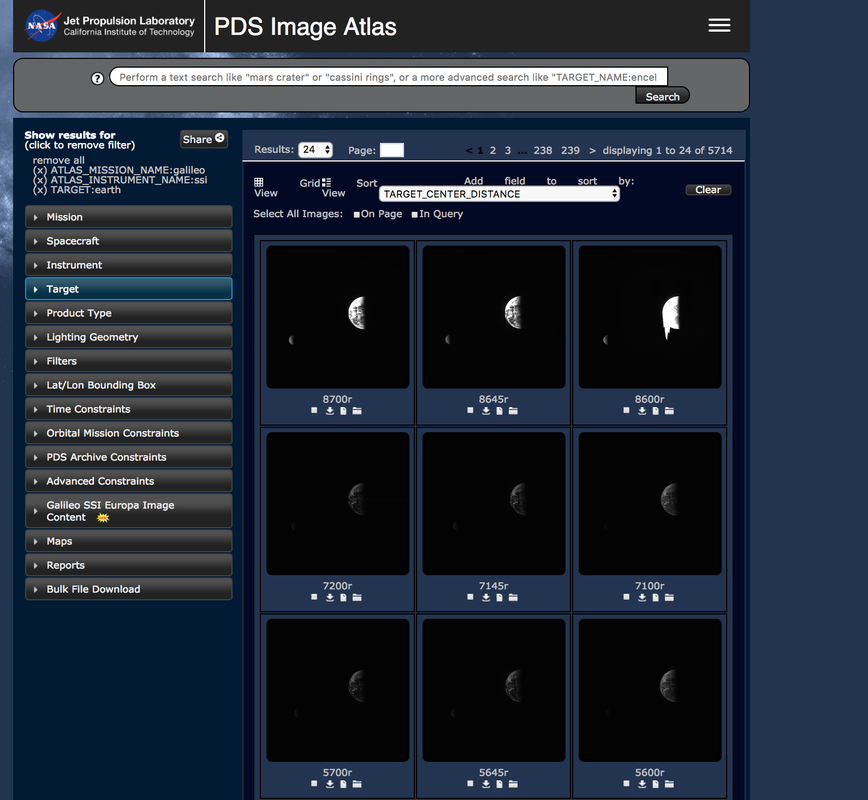 Views of raw Galileo Earth data in JPL's PDS Image Atlas. The Galileo Earth flyby had some images of the Moon, and I knew roughly how bright patches of the Moon should be. Maybe I could use these to boot-strap my way to calibrated Earth images? Or, maybe, since I know about how bright a reflective cloud should be, I could use the clouds in the Earth images to scale everything else? These approaches didn’t exactly leave me feeling confident. Being in a department with a bunch of Solar System planetary geology folks, though, I kept hearing about this USGS-designed software package with the (now unfortunate) name of ISIS ¾ Integrated Software for Imagers and Spectrometers. After doing some snooping, I figured out that ISIS supported calibration of Galileo/SSI data. Now, this aspect of the software was mostly set up to handle images of Jupiter and its satellites. Makes sense as this was the bulk of Galileo’s missions. But, if you dig around in the code a bit, you can spot some places where you can enable the right calibration parameters for the Earth flybys. So, with some grade school-level hacking, I was set ¾ calibrated images that, with the help of some Python plotting packages, resurrected the old Galileo Earth data. In fact, here are some pretty pictures of the distant Earth that I put together for the chapter (in the SSI violet, green, red, and infrared filters): 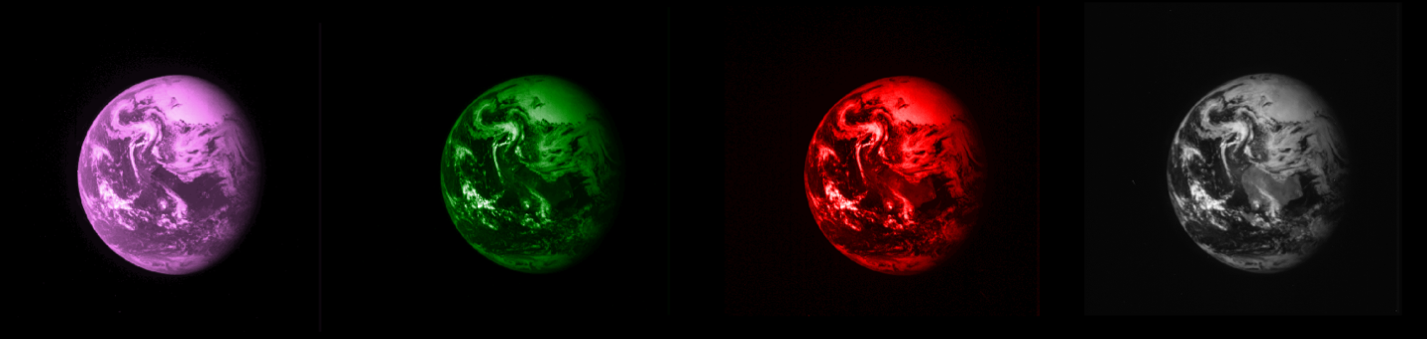 Calibrated images of Earth in the Galileo/SSI violet, green, red, and near-infrared filters. But the really exciting part, from an exoplanet perspective, was to throw out all of that beautiful spatial resolution (imaged exoplanets will always be point sources to us), and to come up with a calibrated, observed spectrum of the Pale Blue Dot. Extremely few of these have been published/released. In fact, you can put them all on one powerful plot, rich with all kinds of information about the surface and atmospheric composition of our home planet. 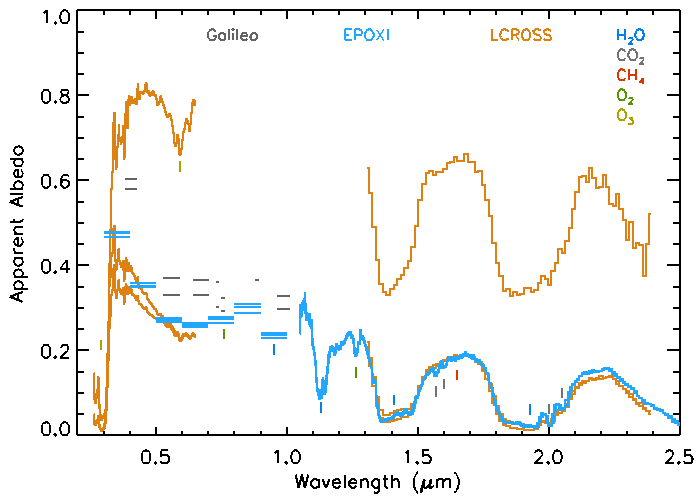 Reflectance data for the distant Earth from three different NASA missions. Gas absorption features are indicated by the colored vertical bars. See the dip in the Galileo photometric data right near 0.76 mm? That’s absorption from molecular oxygen. That’s life!
|
About the Author(S)The contributors to this blog are the students, faculty, and other researchers in the Department of Physics & Astronomy at Northern Arizona University. If you have any suggestions, or would like to contribute to this blog, please email mark.salvatore@nau.edu for more information. Archives
January 2019
Categories |


 RSS Feed
Site powered by Weebly. Managed by Bluehost